Getting Started with dbt on BigQuery
A tool that focuses on transforming your data in data warehouses. This post covers the basics of dbt and transforming data on BigQuery.
Introduction 👋
Hello! I recently got started with dbt as I will be working on a data quality proof of concept at work that primarily uses dbt. The purpose of this post is to give an introduction to dbt and show a fairly simple example of a data model using public data on BigQuery.
What is dbt ❔

dbt (data built tool) is a tool for running data transformations in your data warehouse. It focuses on the T in ELT by running SQL queries to generate tables but in a managed way. Hence, it's easy to incorporate testing, version-controlled updates, documentation, and more. BigQuery is a fantastic data warehouse, but it has a few gaps that dbt fills nicely. No more cumbersome tests to write or inefficient methods for storing queries.
What are its features? 🚀
- Jinja Templating - uses Jinja to create dynamic SQL queries and incorporates functionality such as
ifstatements andforloops. This is handy if you need to writecasestatements with many conditions to check. Additionally, by using macros, you can reuse pieces of SQL code! - Compiler and Runner - developers write their dbt code, and when dbt is invoked (e.g.
dbt run), it will compile all the code into raw SQL and runs it on the desired data warehouse. - Tests - dbt comes with tests out of the box that is easily run by defining it in a
.ymlfile. Tests out of the box include non-null values, unique values, values that exist in another table, and values from a specific list - handy! - Documentation - easily generate documentation using a combination of YAML and Jinja. Once written out with a single command (
dbt docs generate), dbt creates documentation for you - Packages - dbt has a package manager that allows users to use and create repositories of dbt code to be reused. Packages can be either public or private. To view all publicly available packages go here
- Data Snapshots - a way of viewing updates made to a table and seeing exactly what dates a field had a particular value
- Seed Files - map raw values or combine raw data with infrequently changing information using seed files
Why use it? Why not other tools for transforming data? 📈
By running transformations on a Cloud Data Warehouse, like BigQuery, you're leveraging its powerful capabilities, so there's no need to spin up compute to run jobs. Additionally, you can use a familiar language rather than learning a new language, and BigQuery has many built-in functions to use, including its fairly new PIVOT() function!
To execute and manage the transformations only using BigQuery can be a nightmare - trying to make it all work with scheduled queries, saved queries, custom SQL tests and assert statements, custom documentation and so on is a hassle! dbt simplifies tasks required to transform data and makes managing the transformation pipelines much easier. Also, dbt can be orchestrated with Airflow, Dagster, automation servers and more.
With that being said, dbt may not be the best choice if you need to transform real-time data or gnarly logic that cannot be implemented in SQL. Additionally, if you want to extract data and load it into the data warehouse, you'll need another tool as dbt doesn't do that.
An Example with London Bikes Data 🚵♀️
This tutorial demonstrates basic usage of dbt Cloud, creating data models, writing tests and documentation and running dbt commands to run each part easily. The data comes from a BigQuery public dataset on London's Bike usage and assumes users following has a Google Cloud Platform account.
dbt Cloud ☁️
dbt has two ways of interacting with it - dbt Cloud and command line. I'll be using dbt cloud for this tutorial as it provides a nice interface for everything you need. Also, dbt offers a free trial, so you can try the tutorial without paying.
Register and Create a Project ®️
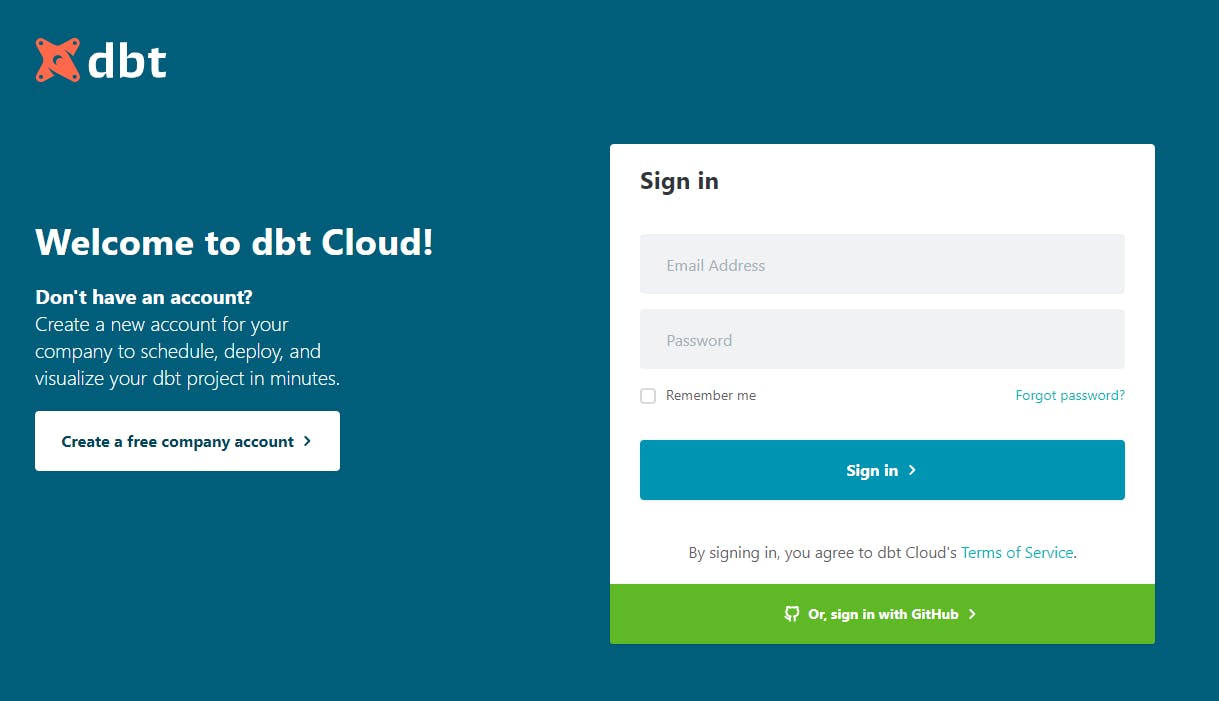
Visit https://cloud.getdbt.com/login/ and create a free account. Once you are logged in, you will see a welcome screen. Next, click on the hamburger icon and click on Projects.
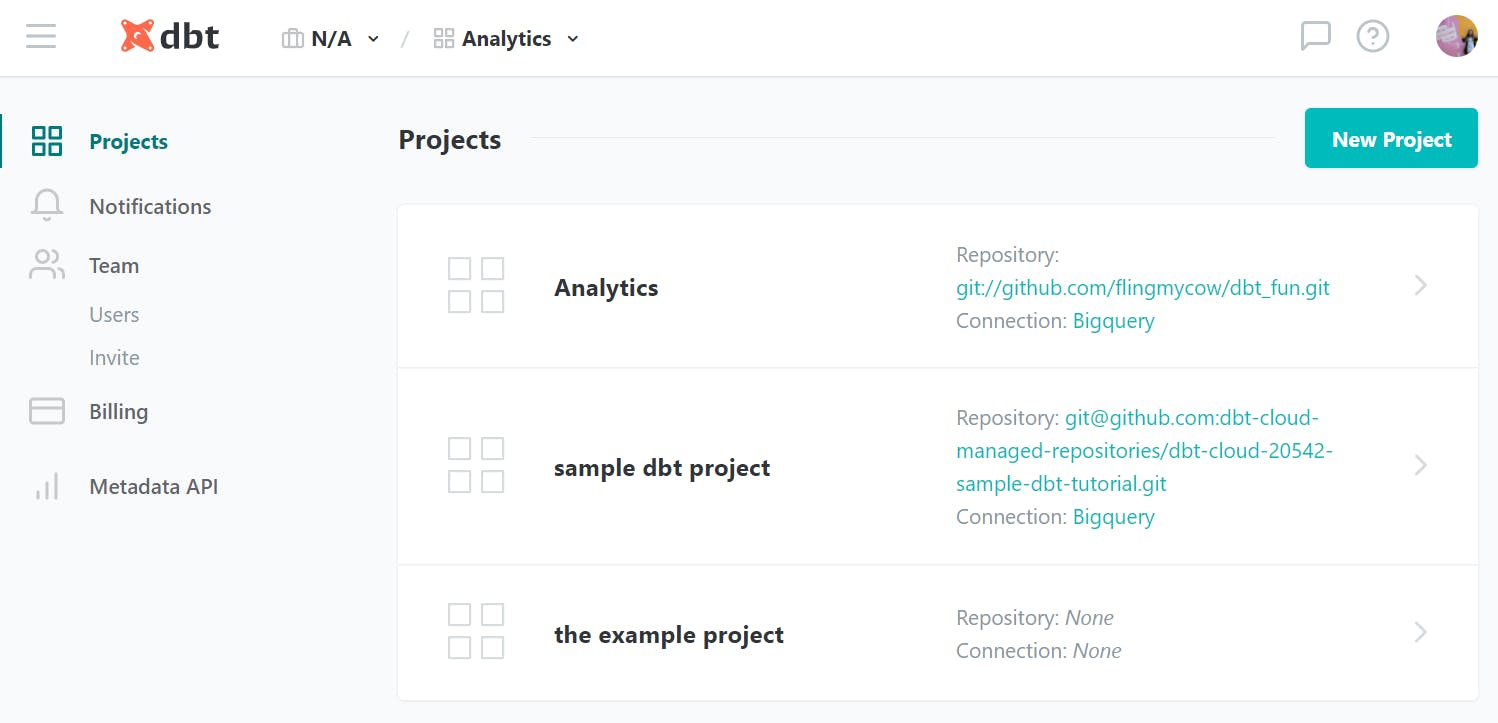
You can either use the provided Analytics project or create a new one. For an easier set up create a new project and follow the step by step instructions to set it up with your information.
Data Warehouse Connection 🖇️
Firstly we want to set up a BigQuery connection, which requires a service account on GCP with IAM roles BigQuery Job User and BigQuery User. You can do this with the API credentials Wizard.
Ensure to use the following responses:
- Which API are you using? BigQuery API
- What data will you be accessing? Application data (you'll be creating a service account)
- Are you planning to use this API with App Engine or Compute Engine? No
- Service account name: dbt-user
- Role: BigQuery Job User & BigQuery User
- Key type: JSON
Then download your JSON key with a memorable name and easy to find location on your computer.
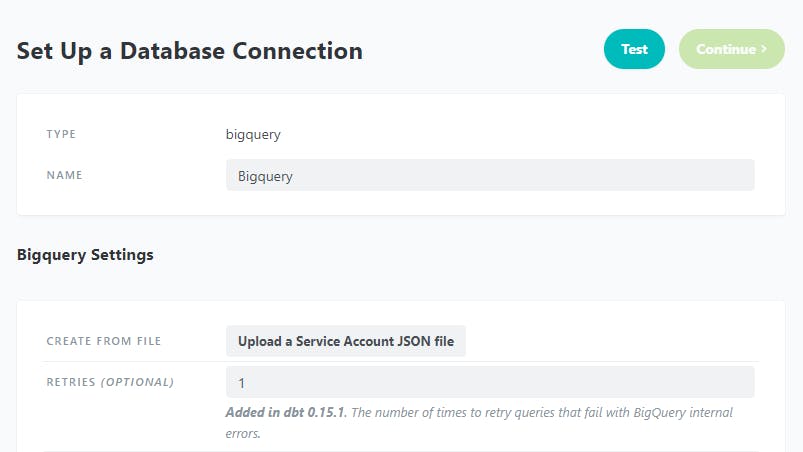
Select BigQuery as the data warehouse then you'll be brought to the configuration page. First, upload the JSON key file by clicking Upload a Service Account JSON file, then the rest of the fields will auto-populate. Next, click on Test to check that the connection works.
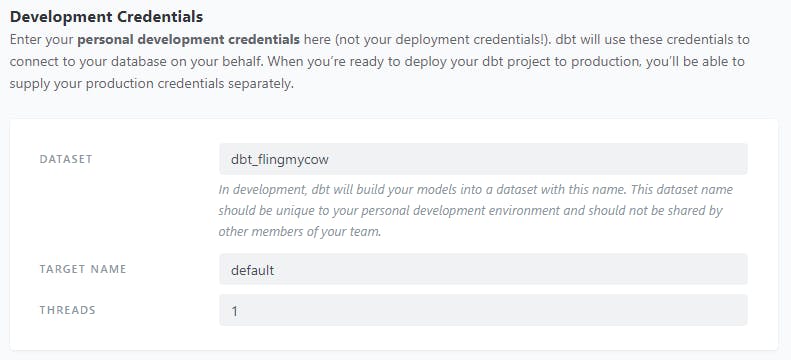
Scroll to the bottom and add the name of the dataset that dbt should write to. In my case, I am writing to a dataset called _dbtflingmycow.
Repository 📂
dbt can use Github, GitLab, or its own managed git repository. It's up to you which repository to use, but the easiest option is to use a managed repository. This can be exported from dbt Cloud at any time.
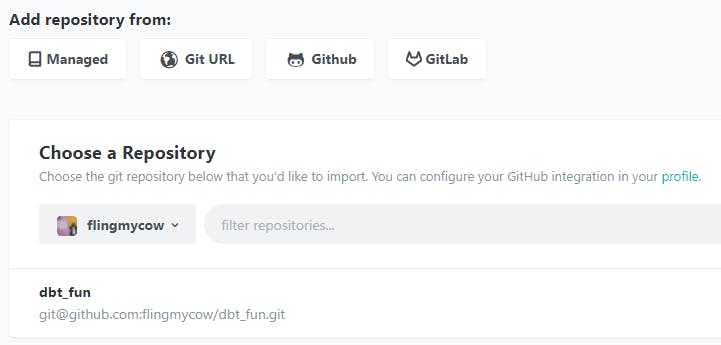
If you've installed the dbt Cloud application in your GitHub account, then you will be able to select a repo from your GitHub org using this interface. If you're not using GitHub or haven't installed the integration yet, you can optionally connect a git repository by providing a git URL from the "Git URL" tab.
Development User Interface 🖥️
Now you should be ready to develop in dbt Cloud! Click on the Hamburger icon and go to Develop. This will show a user interface for writing and running our code.

First, on the upper left corner, click on initialize your project so dbt will create various directories needed and standard configuration.
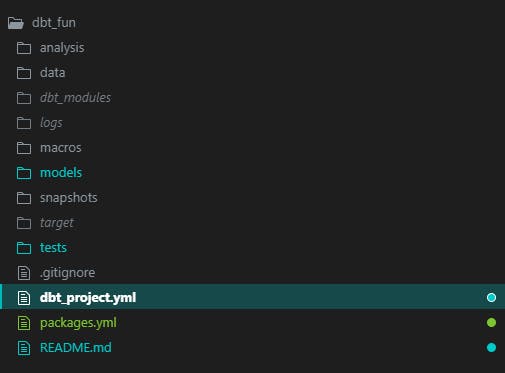
What are these directories for?
analysis- for SQL files that aren't considered to be a dbt modeldata- for seed filesdbt_modules- for dbt packages you install. Later in the post you'll seedbt_utilsin herelogs- where dbt will write logsmacros- for macros filesmodels- for SQL queries that create dbt models *snapshots- for storing snapshotstarget- for storing compiled models and teststests- for storing data tests
The dbt_project.yml file tells dbt the directory is a dbt project. It also contains various settings that tell how dbt to run.

Before jumping into the code, there's one last thing to point at. There is a terminal at the bottom of the interface for entering dbt commands such as dbt run. When you start typing commands, the box recommends commands and provides useful descriptions and a link to the documentation. Also, to view previous executions click on ^Runs, and it'll open up the bottom panel.
London Bikes 🇬🇧
Time to transform the data! In this example, I'll be using BigQuery's public datasets on London bicycle hires and stations. I want to run a simple analysis of bike ride activity in 2017.
Raw Bike Data 🚴♀️
To get started, I'll create a copy of the dataset containing the data that I need. In the models directory, create the file raw_bike_hires.sql with the following code. The name of the file will be the name of the table in BigQuery.
SELECT
    rental_id
    , duration as duration_seconds
    , duration / 60 as duration_minutes
    , bike_id
    , start_date
    , start_station_id
    , start_station_name
    , end_date
    , end_station_id
    , end_station_name
FROM `bigquery-public-data.london_bicycles.cycle_hire`
WHERE EXTRACT(year from start_date) = 2017
Create another file raw_bike_stations.sql with the following code
SELECT
    id
    , name as station_name
    , bikes_count
    , docks_count
    , install_date
    , removal_date
FROM `bigquery-public-data.london_bicycles.cycle_stations`
WHERE install_date < '2017-01-01' and (removal_date < '2018-01-01' or removal_date is null)
We only want stations installed before January 1, 2017, have a removal date before January 1, 2018, or there isn't a removal date.
Cleaned Bike Rides 🧼
The following query takes data from the raw_bike_hires table and generates additional fields for my analysis. As you can see in the FROM clause, we are using Jinja templating, and by using ref([table_name]), we are telling dbt we want to use data from that table.
-- Adding extra fields including if the bike was rented during peak time
SELECT
    SUM(duration_minutes) as total_minutes
    , COUNT(rental_id) as total_bike_hires
    , ROUND(SUM(duration_minutes) / COUNT(rental_id), 2) AS average_duration
    , EXTRACT(month from start_date) as month
    , CASE
        WHEN EXTRACT(HOUR from TIMESTAMP(start_date)) >= 6 AND EXTRACT(HOUR from TIMESTAMP(start_date)) <= 10 THEN 'Morning Peak'
        WHEN EXTRACT(HOUR from TIMESTAMP(start_date)) >= 16 AND EXTRACT(HOUR from TIMESTAMP(start_date)) <= 19 THEN 'Evening Peak'
        ELSE 'Off-Peak'
      END AS start_peak_travel
    , IF(start_station_id = end_station_id, True, False) as same_station_flag
    , start_station_id
    , start_station_name
    , end_station_id
    , end_station_name
FROM {{ ref('raw_bike_hires') }}
GROUP BY 4,5,6,7,8,9,10
ORDER BY total_minutes DESC
Analysis Tables 📊
Now that we have our tables ready, we can join them to create the final table for analysis. This query takes all of the bike rides and aggregates them by journeys with the same stations, month, and time of day. This gets a total duration, the total number of rides, average duration, and so on. I generated the table using CTEs to separate the logic.
Create another file 2017_rides_by_month.sql with the following code
WITH stations AS (
    SELECT *
    FROM {{ ref('raw_bike_stations') }}
),

rides AS (
    SELECT *
    FROM {{ ref('cleaned_bike_rides') }}
),

start_stat_join AS (
    SELECT rides.*
    , stations.bikes_count as start_station_bikes_count
    , stations.docks_count as start_station_docks_count
    , stations.install_date as start_station_install_date
    FROM rides
    LEFT JOIN stations
    ON rides.start_station_id = stations.id
)

SELECT
    total_minutes
    , total_bike_hires
    , average_duration
    , month
    , start_peak_travel
    , same_station_flag
    , start_station_id
    , start_station_name
    , start_station_bikes_count
    , start_station_docks_count
    , start_station_install_date
    , end_station_id
    , end_station_name
    , stations.bikes_count as end_station_bikes_count
    , stations.docks_count as end_station_docks_count
    , stations.install_date as end_station_install_date
FROM start_stat_join
LEFT JOIN stations
ON start_stat_join.end_station_id = stations.id
Before we run anything, overwrite the dbt_project.yml file with the following code.
name: 'london_bike_analysis'
version: '1.0.0'
config-version: 2

# This setting configures which "profile" dbt uses for this project.
profile: 'london_bike_analysis'

# These configurations specify where dbt should look for different types of files.
source-paths: ["models"]
analysis-paths: ["analysis"]
test-paths: ["tests"]
data-paths: ["data"]
macro-paths: ["macros"]
snapshot-paths: ["snapshots"]

target-path: "target"  # directory which will store compiled SQL files
clean-targets:         # directories to be removed by `dbt clean`
    - "target"
    - "dbt_modules"

models:
  london_bike_analysis:
    +materialized: table
The dbt_project.yml file tells dbt that the directory is a dbt project. Additionally, it contains configurations that informs dbt how it should operate. For example, I tell dbt to create all models as a table in the london_bike_analysis namespace in my file.
At this point, you should have three files in the models directory and an updated project configuration file. Then, in the terminal of dbt Cloud, run the command dbt run, and it will create all the models.

You should see something like this in dbt Cloud, and once it is finished running, you can see the tables in BigQuery. Notice how dbt determined the creation order of the tables.

Your dataset in BigQuery will now have the tables.

Now we can run queries on this data. For example, perhaps I want to see if there's a difference in activity for journeys that use different stations and travel at different times of the day.
SELECT
    same_station_flag
    , start_peak_travel
    , sum(total_bike_hires) as total_bike_hires
    , avg(average_duration) as average_duration
FROM `your_gcp_project.dbt_flingmycow.rides_by_month_in_2017`
GROUP BY 1,2
ORDER BY total_bike_hires DESC
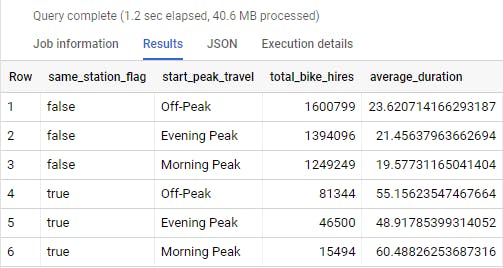
Looking at the entire dataset, there are much more bike rides where the start station isn't the same as the ending station, and on average, these journeys are shorter than the other category.
Features like testing and documentation ⭐
Anywho, the purpose of this post isn't to analyse the data but to show a few primary features of dbt. In the next step, we will include testing and documentation for our models.
Testing ✅
In dbt, there are two types of tests - schema and data tests.
Data tests run SQL queries for specific tests where the result can't be determined from a schema test. This is usually for business logic tests.
Schema tests check for certain properties against your models and will only pass if all records pass. dbt comes with the following four tests:
unique- values should be unique in a specific column (e.g. Sales Order ID)not_null- values should not contain null valuesaccepted_values- values must be found in the provided listrelationships- each value in a column must exist in a column in another model
These are a great starting point, but I wanted additional tests. Fortunately, dbt has a package dbt_utils we can use to include more test cases. Create a packages.yml file in the project directory (same level as dbt_project.yml) with the following code:
packages:
  - package: fishtown-analytics/dbt_utils
    version: 0.6.6
Run dbt deps in the terminal to install the package dbt_utils, which will be added to the dbt_modules folder. If you want to read more about this package, then visit this link
Now we can write schema tests - create a schema.yml file in the models directory and add the following code:
version: 2

models:
  - name: cleaned_bike_rides
    columns:
      - name: total_minutes
        tests:
          - not_null
          - dbt_utils.at_least_one
      - name: total_bike_hires
        tests:
          - not_null
          - dbt_utils.at_least_one
      - name: month
        tests:
          - not_null
          - dbt_utils.at_least_one
      - name: start_peak_travel
        tests:
          - accepted_values:
              values: ['Evening Peak', 'Off-Peak', 'Morning Peak']
      - name: same_station_flag
        tests:
          - not_null
      - name: start_station_name
        tests:
          - not_null
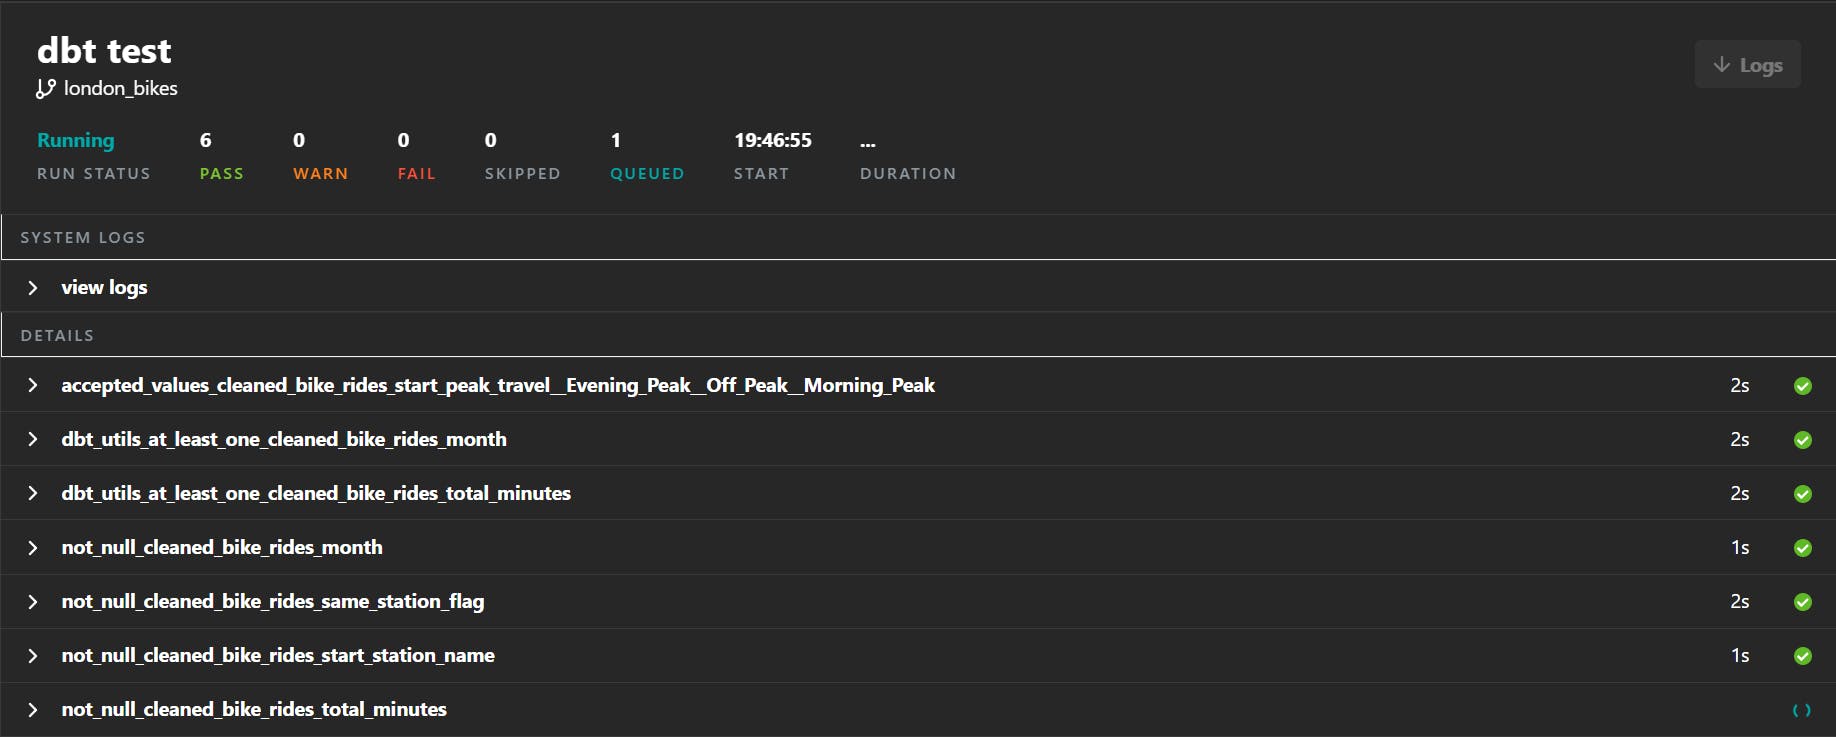
If you go through each column, you can see at least one test applied. Most of them are checking the column isn't null, a few check the number is at least one, and start_peak_travel must match one of the values in the list. To run the tests, enter the dbt test command, and it will go through each one.
Before we finish, I want to demonstrate a simple example of a SQL test. Create a file in the tests directory called assert_stations_before_2017.sql and add the following SQL query
SELECT *
FROM {{ ref('2017_rides_by_month')}}
WHERE end_station_install_date >= '2017-01-01'
A data test is considered passed if it returns no rows. In our case, we want to ensure our 2017 dataset only has bike stations installed before 2017. If we have no rows, then we know the data is correct in regards to time.
Again, this test will be picked up by the dbt test command, so run that again, and you'll see the results.

Documentation 📄
Now that we have tests set up for our data, let's move on to documentation. To generate project documentation, we use the dbt docs generate command. If you run this, it automatically produces pages for each model, including data size, number of rows, schema, dependencies (including lineage graph) and both source and compiled SQL.

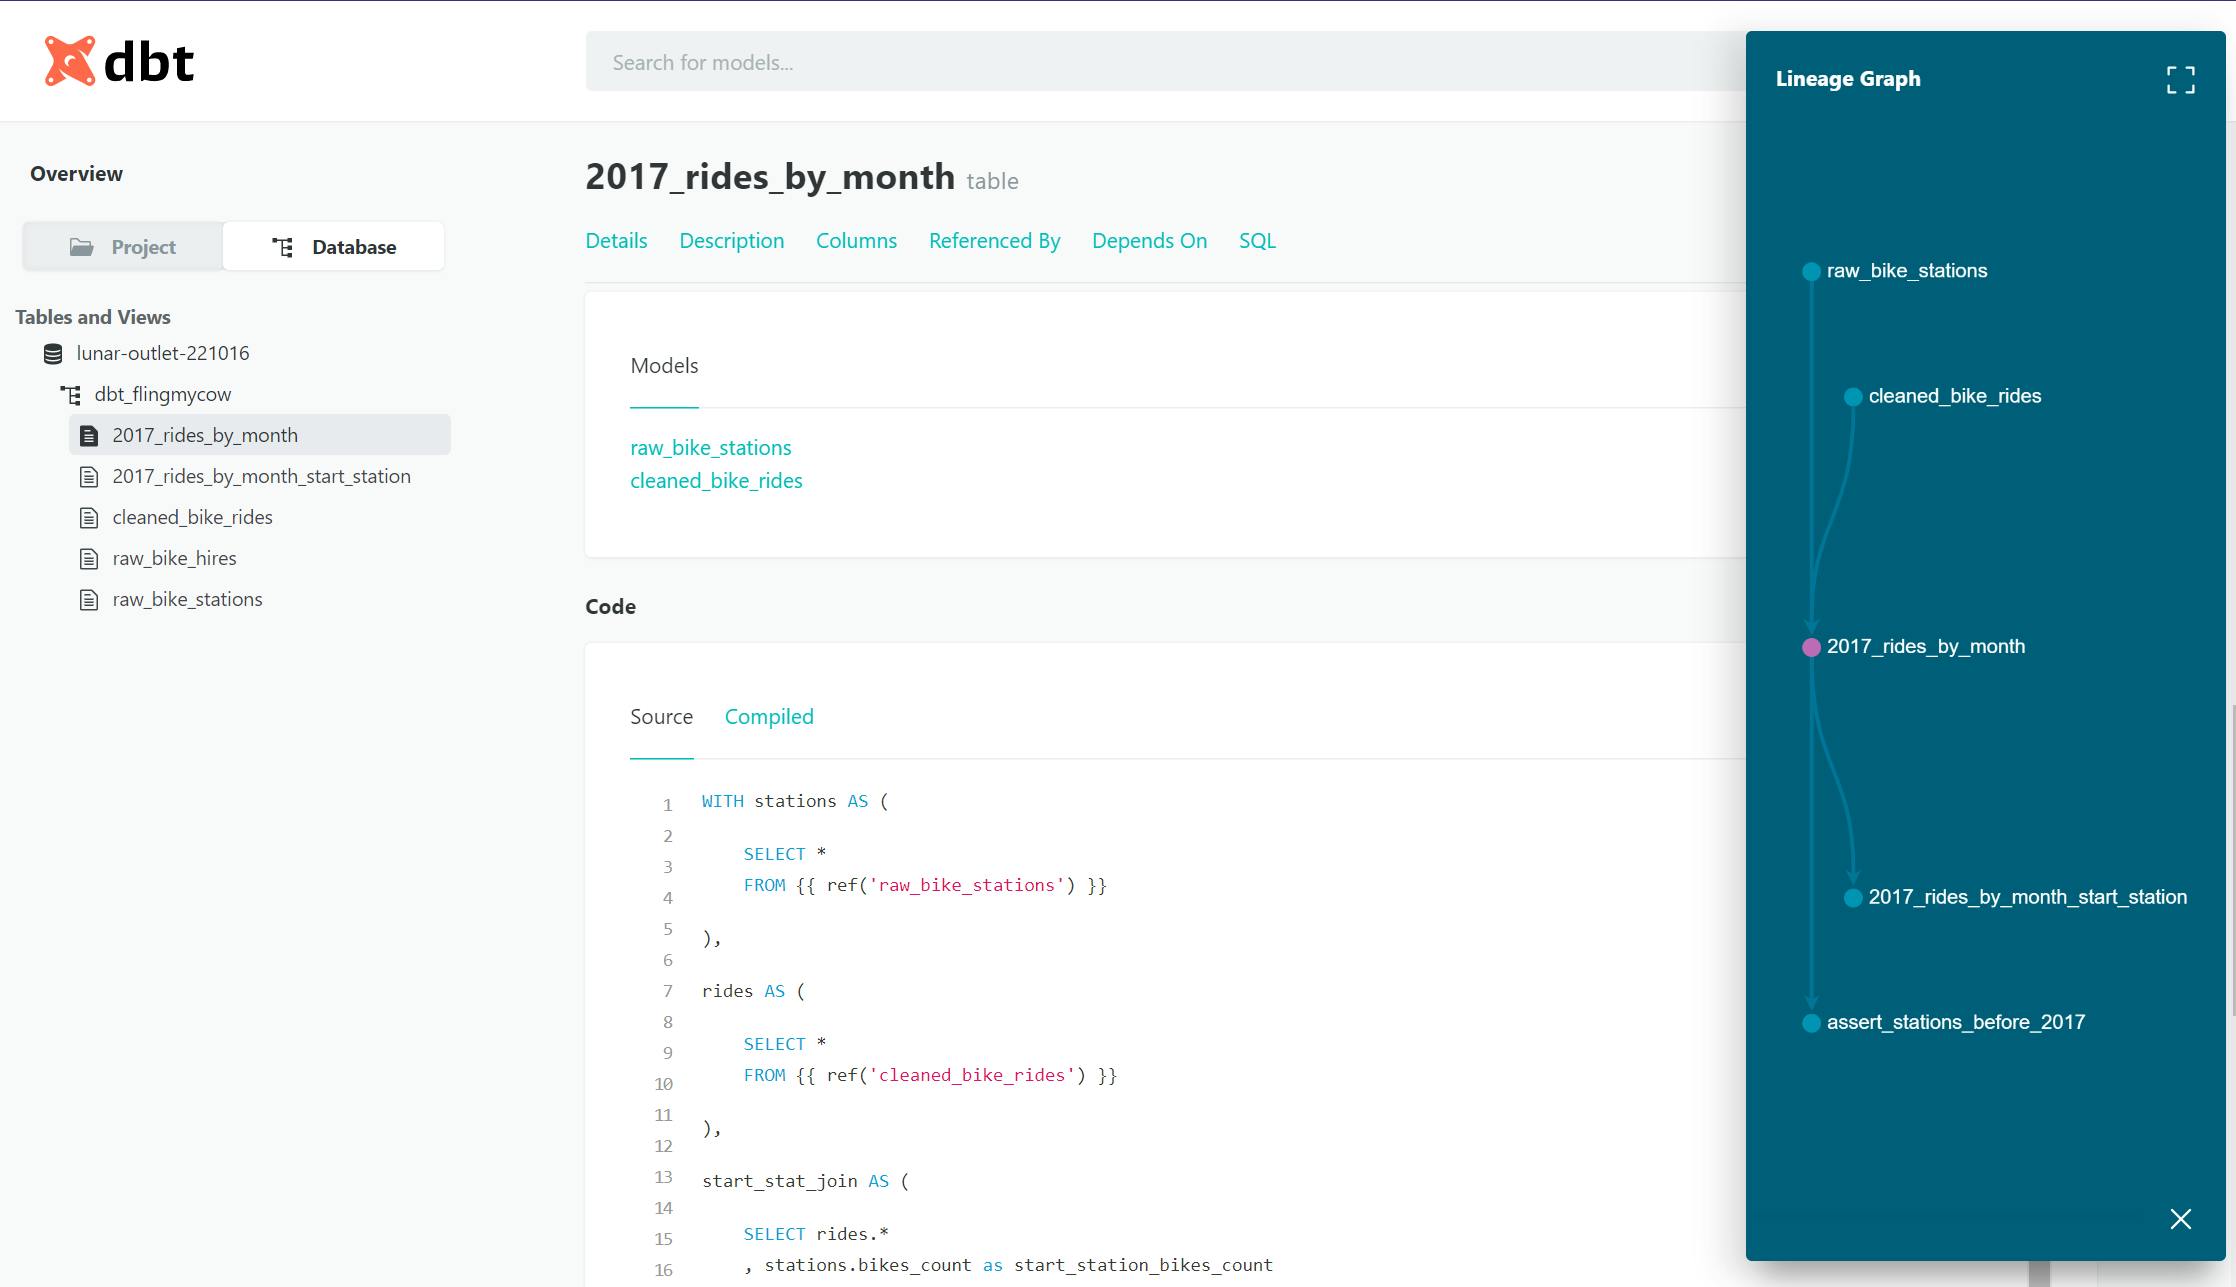
This is a great starting point, but let's add a bit of context to the models. You can add descriptions to models and fields using a descriptions field in the schema.yml file like this.
  - name: cleaned_bike_rides
    description: >
      This table contains a transformed version of the raw_bike_hires table, which includes additional calculated fields such as creating a duration in minutes.
      Each ride has been aggregated, so any journey that starts and ends at the same station in the same month and roughly the time of day are aggregated together to get the total minutes similar journeys have taken.
    columns:
      - name: total_minutes
        description: The total minutes of a particular journey in a month and general time of day.
        tests:
          - not_null
          - dbt_utils.at_least_one
We can have our tests and descriptions in the same file. If you have a quite long description, then use > and a new line to indicate a multi-line string.
Update your schema file with descriptions and re-run dbt docs generate to update the documentation for the cleaned_bike_rides model.
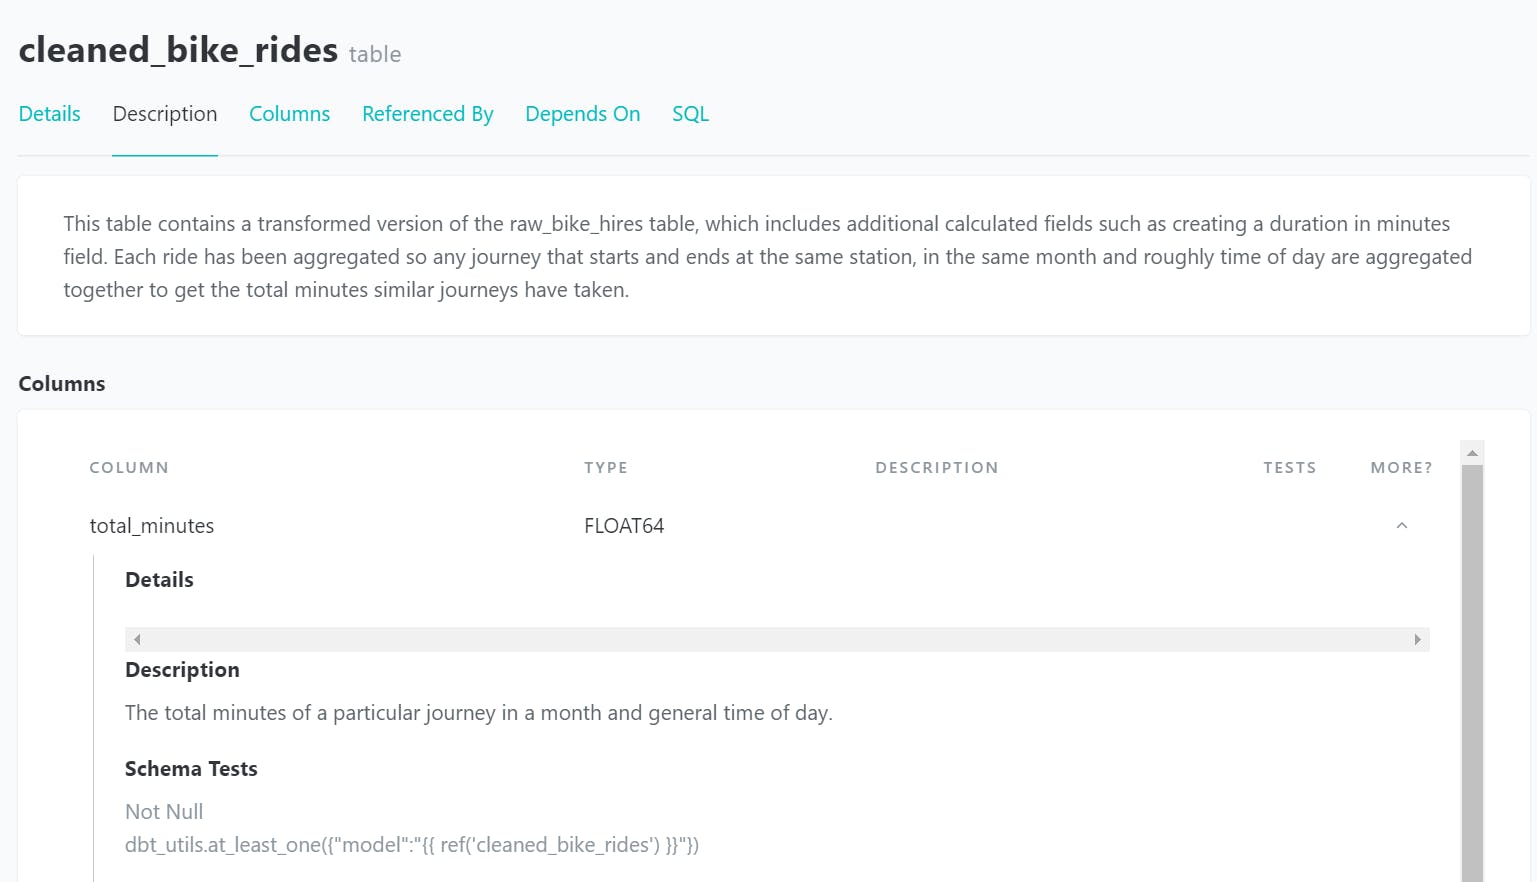
We can take our documentation to the next level by using Docs Blocks with markdown files. To do this, create a markdown file in the models directory called raw_bikes_docs.md with the code.
{% docs raw_bikes_hires %}

## This table contains all bikes hired in London in 2017. This is the raw dataset, so no cleaning or transformation.

### Links

* Want to know more about London bikes? [Visit this link](https://tfl.gov.uk/modes/cycling/santander-cycles)'
* More information on [GCP Solutions - BigQuery datasets](https://cloud.google.com/solutions/datasets)

### Image!

A photo of london and people travelling from pexels.com because we can :)
<img src='https://images.pexels.com/photos/3626589/pexels-photo-3626589.jpeg?auto=compress&cs=tinysrgb&dpr=3&h=750&w=1260' width='20%'>

{% enddocs %}
To define a doc block, use the command %{ docs [name-of-block-here] %} and end the file with {% enddocs %}. Then reference this doc block in the schema.yml file with the doc() function.
models:
  - name: raw_bike_hires
    description: '{{ doc("raw_bikes_hires") }}'
Run the dbt generate docs command one more time, and now the raw_bike_hires page has an image! How exciting. This means we can be more creative and flexible with how we format our documentation.
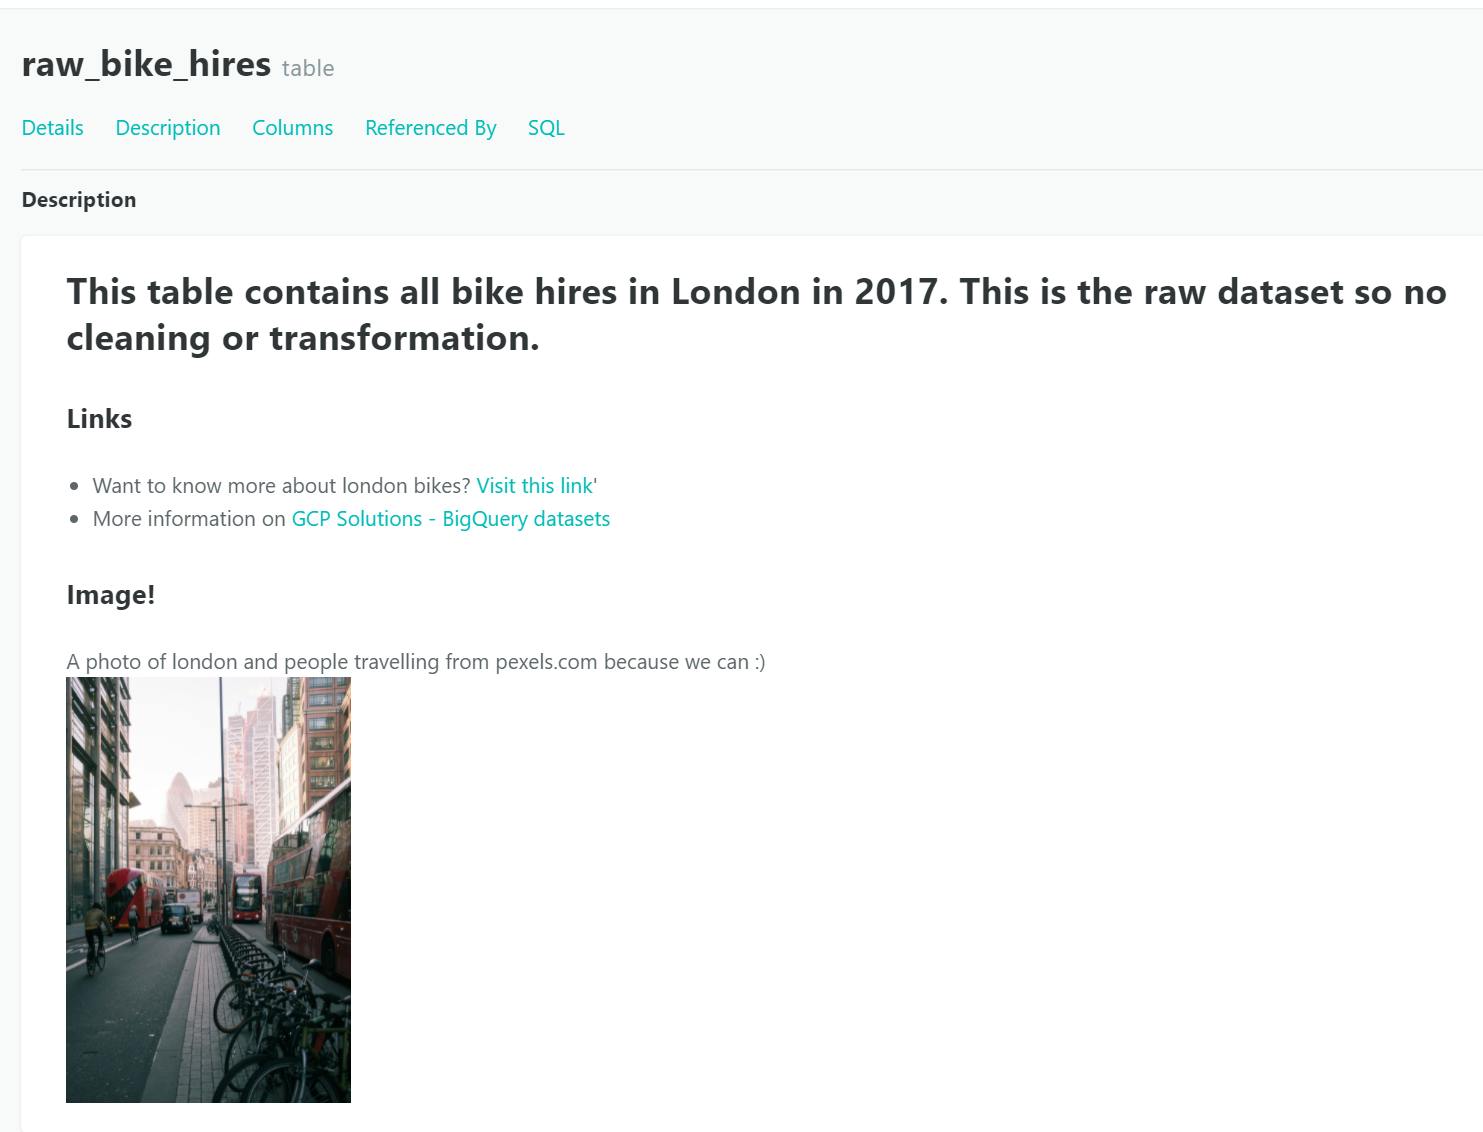
If you're using the CLI to generate documentation, you will need dbt docs serve to view your documentation locally. To host the documentation, you have a few options, including dbt Cloud, Netlify, use a web server or host on the cloud. Fortunately, as the documentation is static, this means a dynamic server isn't required.
Conclusion 🔚
Once you're ready with your data models and tests, you can commit them on dbt Cloud. At this point, you would create a production environment and (usually) deploy your transformations to run on a schedule.
If you would like to see the code, it's available in my Github repository here.
Resources 📚
- dbt starter project
- is dbt the right tool for my data transformations - dbt blog
- configuring dbt Cloud documentation
Arigato👋
Thank you for reading, and I hope you found this introduction to dbt useful! If you have any comments, I would love to hear from you.